04/09/2024 04:55
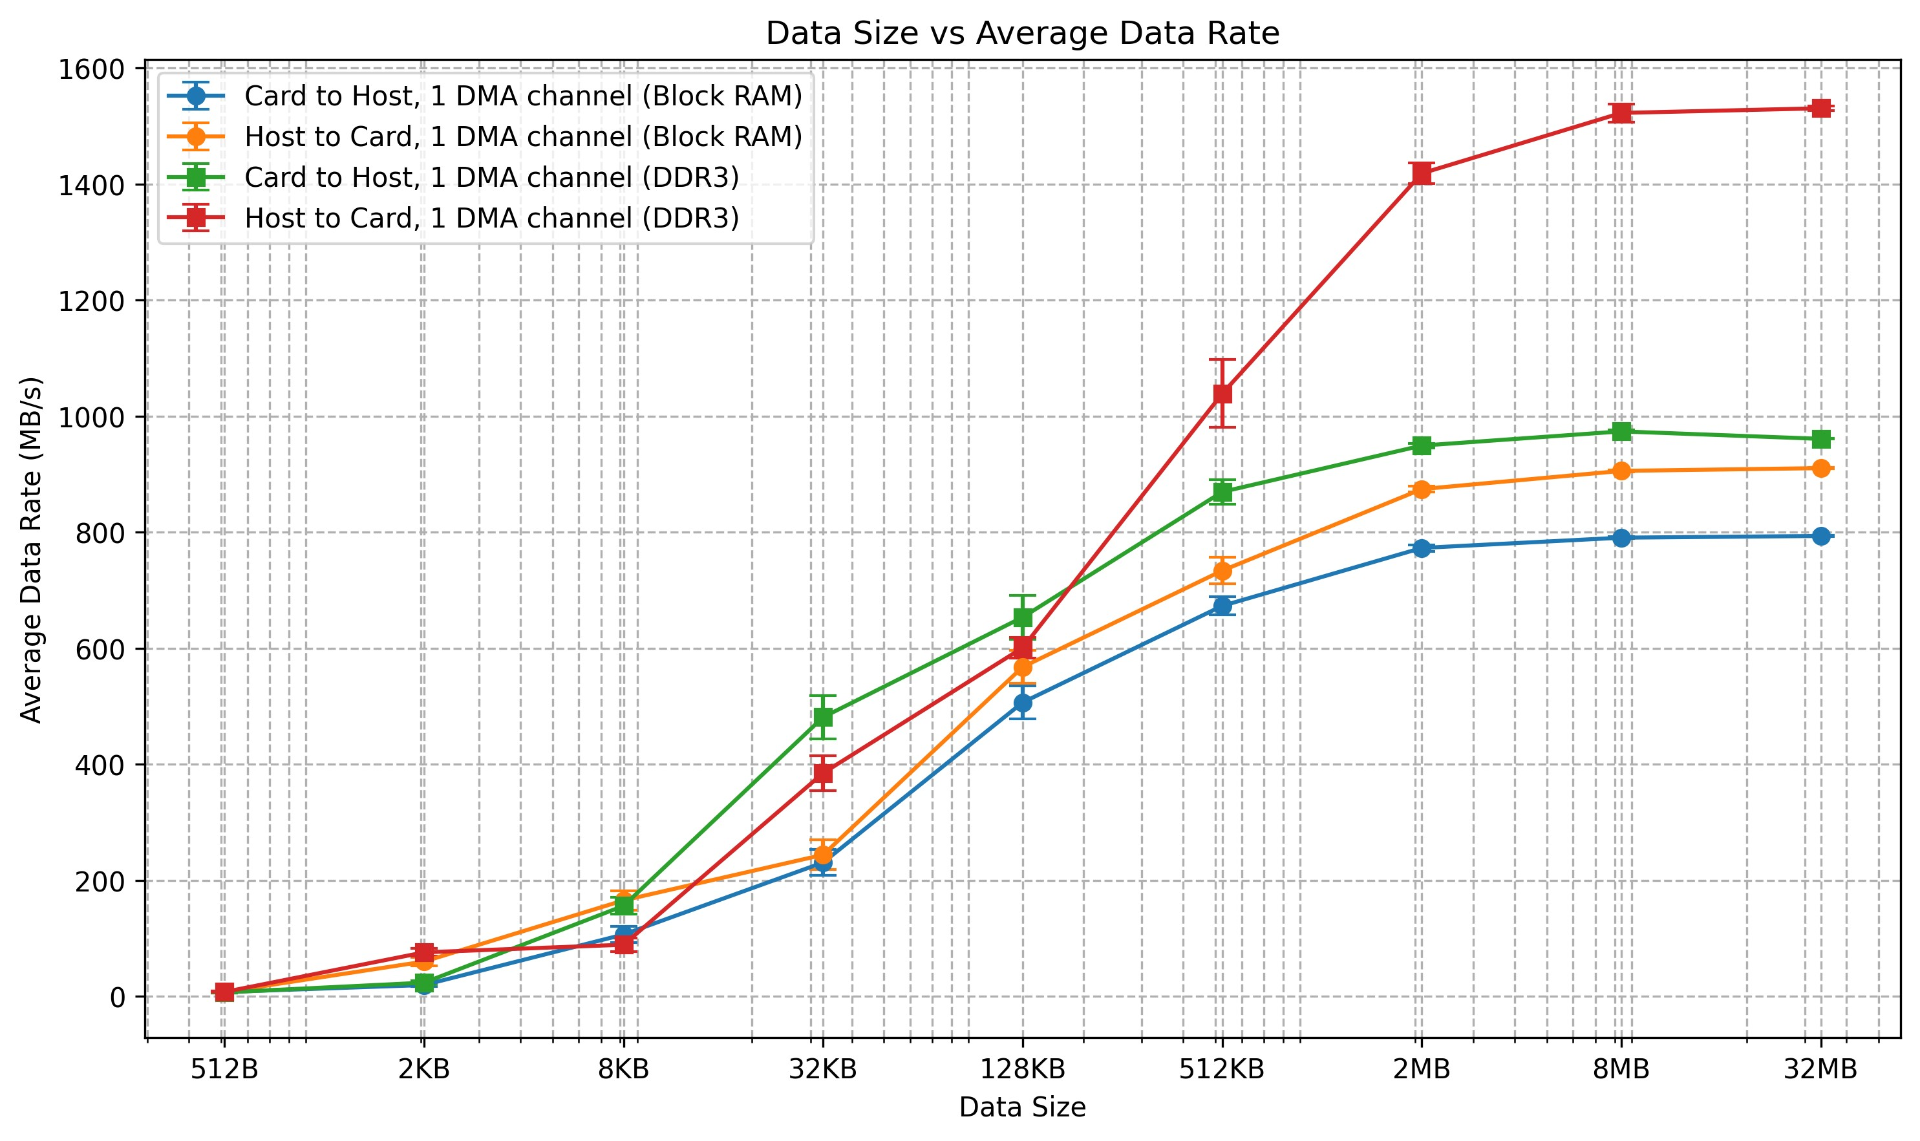
It seems there is a statistically signficant difference between the DDR3 DMA and Block RAM DMA. Particularly in host to card (h2c) transfers. This is evidence that changing the firmware may have actually had an effect. It is also possible that the system capabilities vary based on what's running on the system (but I find this doubtful).
04/09/2024 05:11
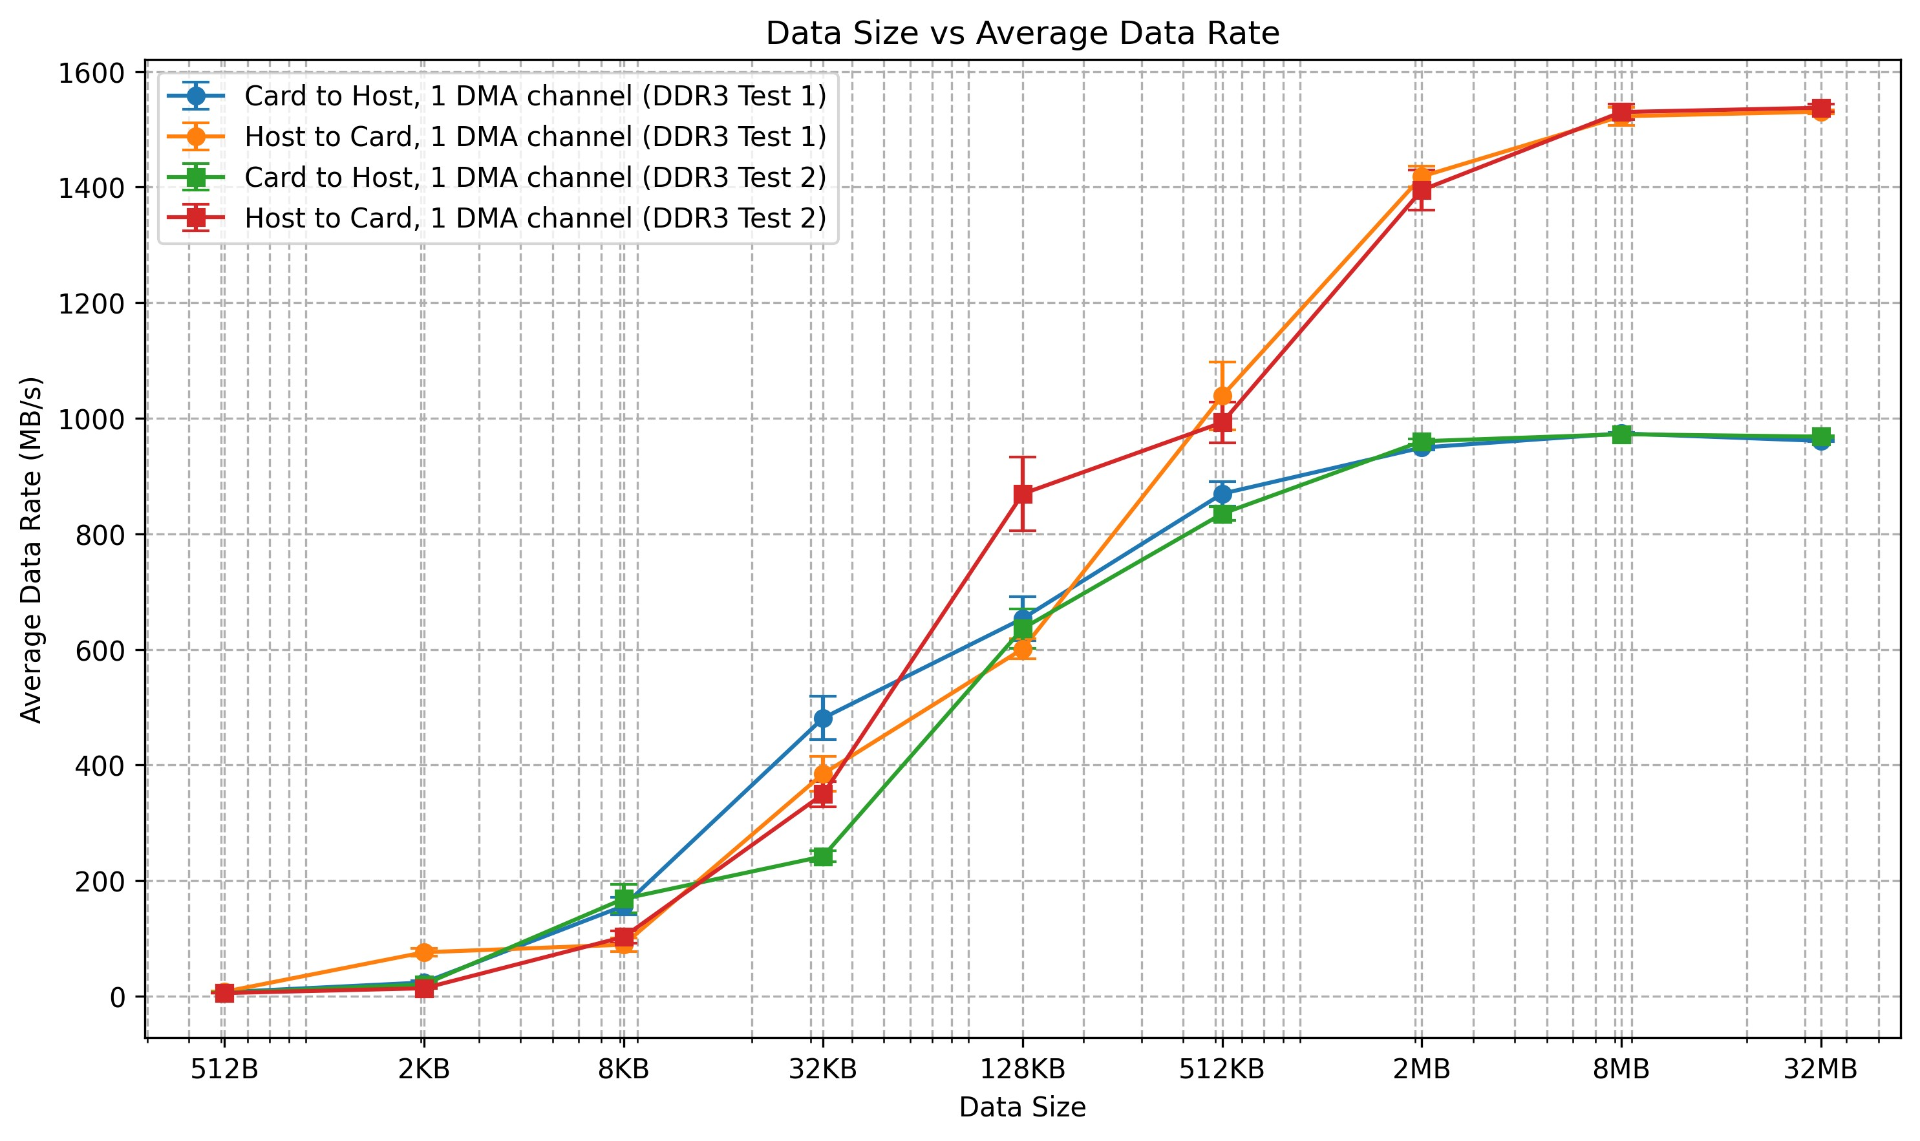
As a sanity check, I ran the DDR3 tests again. It seems fairly unstable for lower data transfer sizes. But the results seem the same for higher data transfer sizes.
04/09/2024 05:42
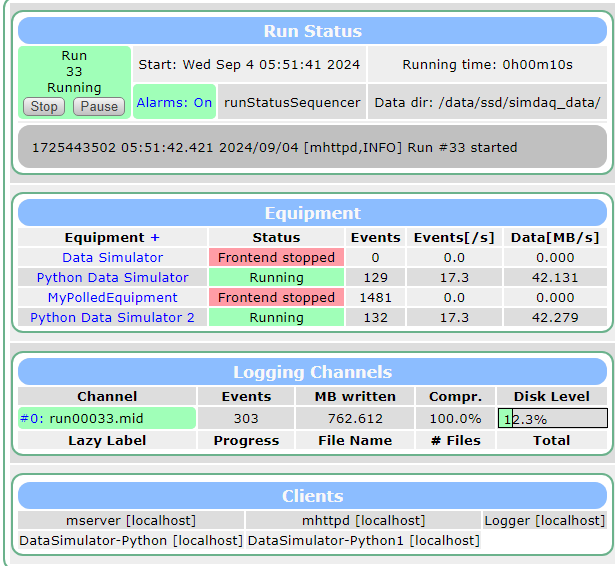
Using the python frontend, I tested the data rate it was able to write to the SSD. Example screenshot:
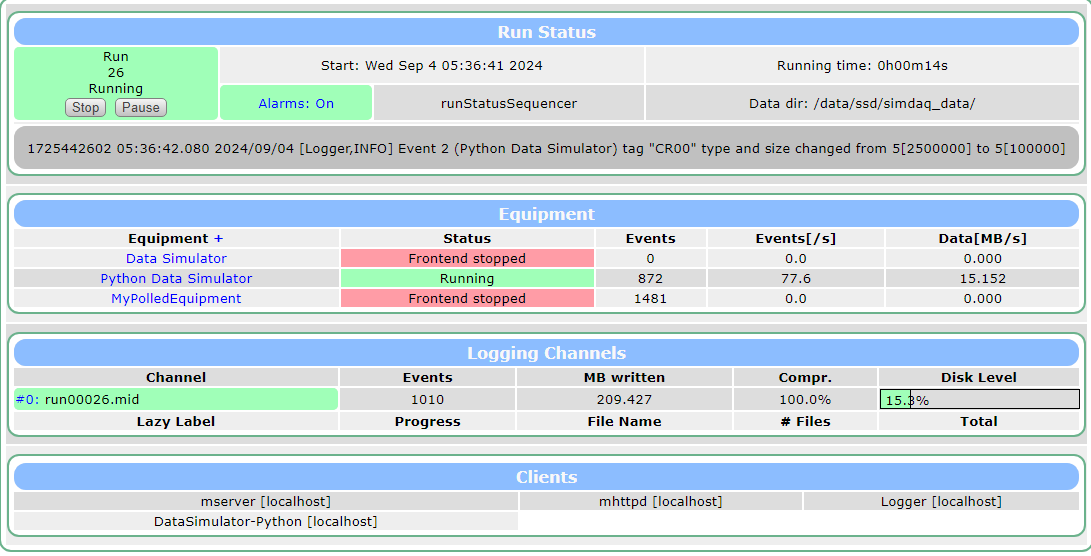
I wrote a specified amount of zeros to a midas bank for each event. By changing the amount of zeros I observed the effect on the event rate and the data rate. The target event rate for each of these was 100 Hz.
| Number of Zeros in Buffer | Event Rate [events/s] | Data Rate [MB/s] |
|---|---|---|
| 1000 | 94.5 | 0.186 |
| 10000 | 90.9 | 1.778 |
| 50000 | 86.5 | 8.451 |
| 100000 | 77.6 | 15.152 |
| 250000 | 49.1 | 23.998 |
| 500000 | 43.2 | 42.201 |
| 1250000 | 18.3 | 44.647 |
| 2500000 | 3.6 | 17.757 |
| 5000000 | 0.6 | 5.976 |
It appears the max data rate is about 45 MB/s. This is over 20 times worse than the max data rate seen using a similar C++ frontend. Furthermore, achieving the high data throughput causes the event rate to suffer.
04/09/2024 05:48
So I thought, "okay but what if we could have two frontends spewing data, could we get a higher write rate?". So I did that using these specs:
| Number of Zeros in Buffer | Event Rate [events/s] | Data Rate [MB/s] |
|---|---|---|
| 1250000 | 18.3 | 44.647 |
Screenshot:
And wouldn't you know it, we get effectively double the data rate. Maybe we can avoid this multiple frontend nonsense with some multithreading(?).
05/09/2024 20:39
In response to a message asking how to optomize python data rate performance:
https://daq00.triumf.ca/elog-midas/Midas/2826
What limits the rate that poll_func is called in a python frontend?
First the general advice: if you reduce the "period" of your equipment, then your function will get called more frequently. You can set it to 0 and we'll call it as often as possible. You can set this in the ODB at "/Equipment/Python Data Simulator/Common/Period"
If that's still not fast enough, then you can return a list of events from your readout_func. I've seen real-world cases of 25kHz+ of midas events generated in this fashion.
However in your case the limitation is likely that you're sending 1.25MB per event and we have a lot of data marshalling to do between the python and C++ layer. In particular it takes 15ms on my machine to just pack the data into a memory buffer (see timeit command below). I am sure there must be a faster way to do this packing, especially in the case where the bank contains a numpy array rather than a python list.
I'll add it to my to-do list to investigate improving the performance of medium-to-large events in the python code.
Cheers,
BenP.S. You may have a bug in your calculations (depending on how you did your testing). In poll_func I think you should be updating the stats every time the function is called, not just the times when you return True.
P.P.S. Command I used to test how slow it is to pack the data. One-time setup of creating the buffers, then multiple tests of the pack_into function:
python -m timeit -s "import struct;import ctypes;arr = [0]*1250001;buf = ctypes.create_string_buffer(10000000);fmt = ">1250000d"" "struct.pack_into(fmt, buf, *arr)"
20 loops, best of 5: 15.3 msec per loop
As he suggested in the last line (this just show how long it takes data to move from C++ to python)
[root@dhcp-10-163-105-238 frontend_simulator]# python -m timeit -s "import struct;import ctypes;arr = [0]*1250001;buf = ctypes.create_string_buffer(10000000);fmt = \">1250000d\"" "struct.pack_into(fmt, buf, *arr)"
10 loops, best of 3: 43.7 msec per loop
[root@dhcp-10-163-105-238 frontend_simulator]# python -m timeit -s "import struct;import ctypes;arr = [0]*1250001;buf = ctypes.create_string_buffer(10000000);fmt = \">1250000d\"" "struct.pack_into(fmt, buf, *arr)"
10 loops, best of 3: 43.7 msec per loop
This suggests our maximum data rate is (1000/43.7) Hz * 1.25 MB/s = 23 MB/s ? This seems wrong, as we surpass this limit.
06/09/2024 15:23
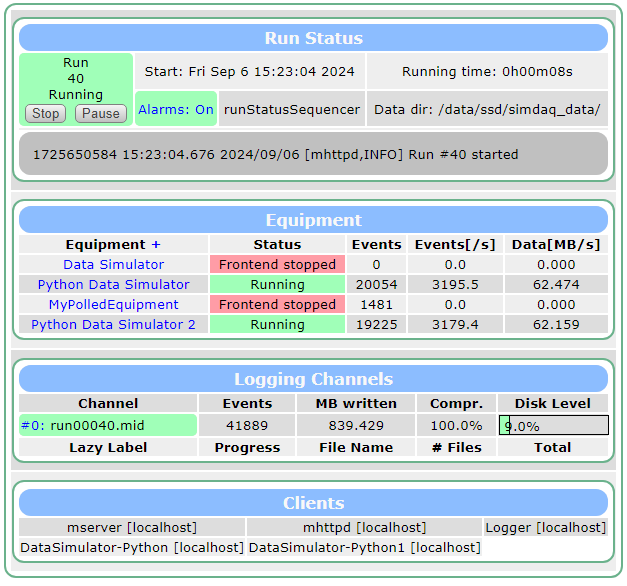
Using the suggestions, I set the rate to unlimited (0 period) and my artificial polling rate to 10kHz with each event being an array of zeros length 10000.
I cap out at 60 MB/s per frontend.
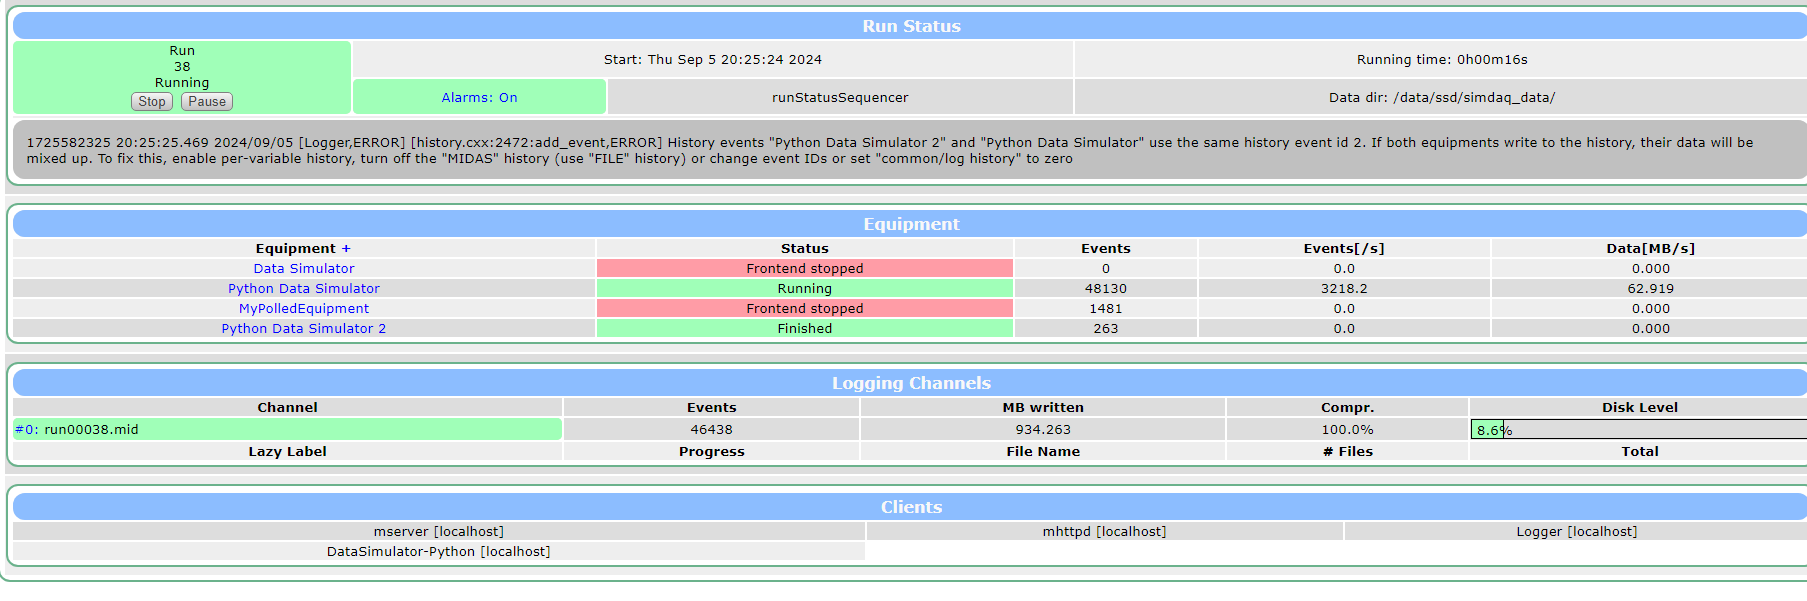
06/09/2024 15:53
With no data limitations, I'm able to generate data at around 10kHz
06/09/2024 15:55
Some new data:
| Number of Zeros in Buffer | Target Event Rate [events/s] | Event Rate [events/s] | Data Rate [MB/s] |
|---|---|---|---|
| 1 | 10000 | 9700 | 0.265 |
| 1000 | 10000 | 7700 | 15.2 |
| 10000 | 10000 | 3200 | 62.9 |
| 20000 | 10000 | 2000 | 78.3 |
| 30000 | 10000 | 1430 | 84.2 |
| 40000 | 10000 | 1100 | 87.0 |
| 50000 | 10000 | 900 | 88.4 |
| 60000 | 10000 | 770 | 90.5 |
| 70000 | 10000 | 670 | 91.6 |
| 80000 | 10000 | 590 | 92.1 |
| 90000 | 10000 | 528 | 92.6 |
| 100000 | 10000 | 472 | 92.3 |
| 150000 | 10000 | 245 | 72.2 |
| 200000 | 10000 | 182 | 71.1 |
| 500000 | 10000 | 62 | 60.1 |
So our "new record" is about 100 MB/s
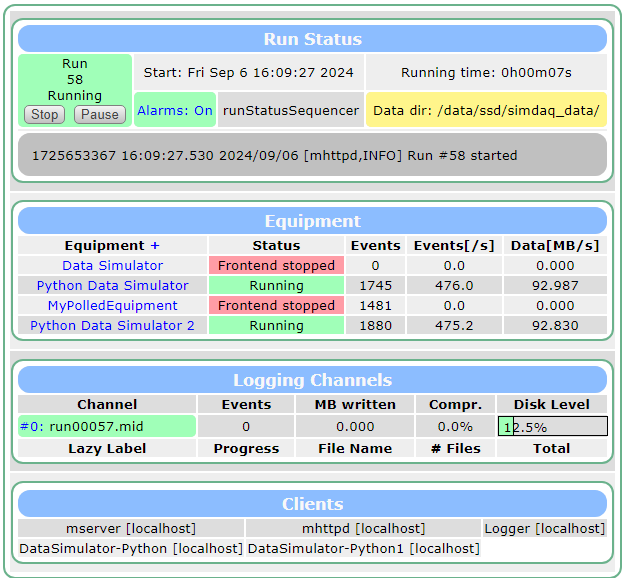
06/09/2024 16:11
For parameters:
| Number of Zeros in Buffer | Target Event Rate [events/s] | Event Rate [events/s] | Data Rate [MB/s] |
|---|---|---|---|
| 100000 | 10000 | 472 | 92.3 |
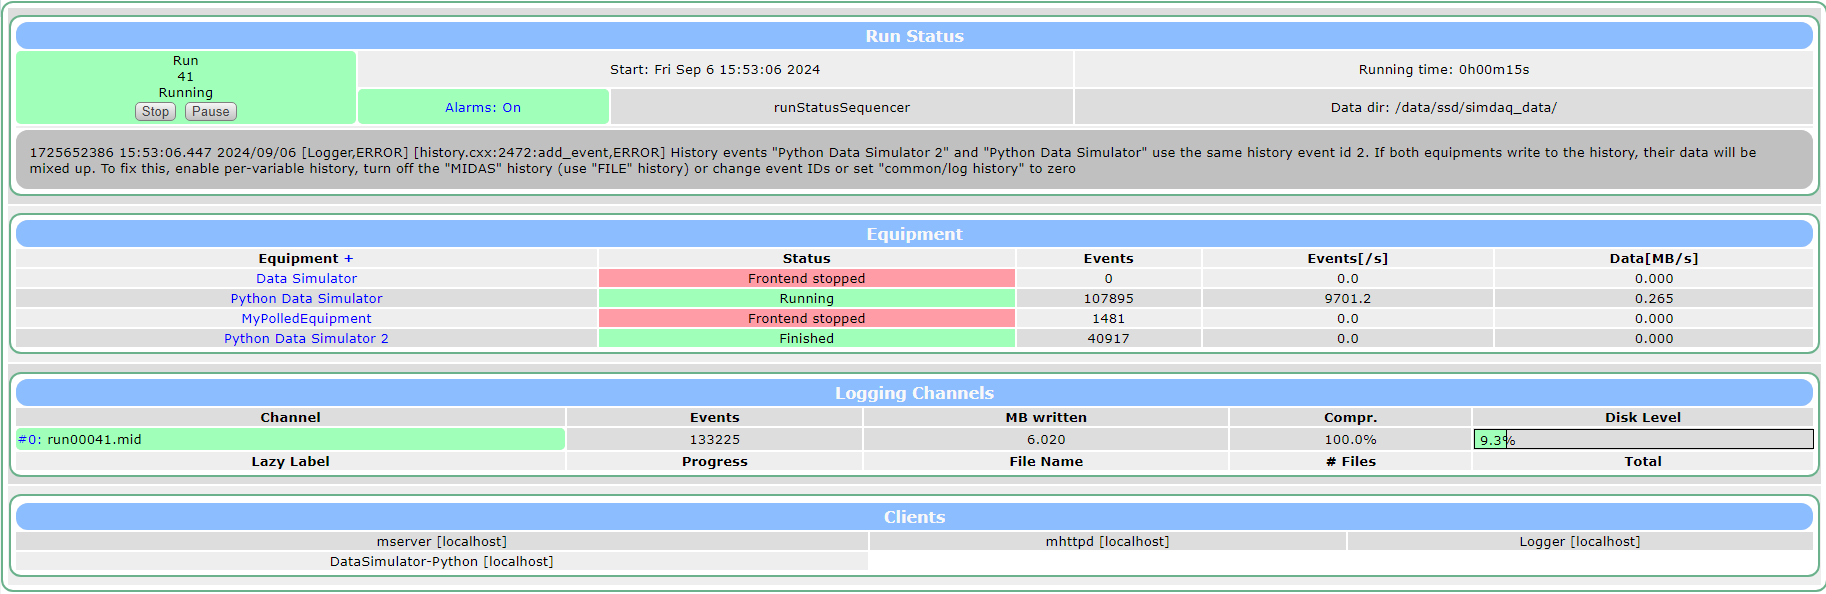
We see limited bottlenecking when another frontend is added:
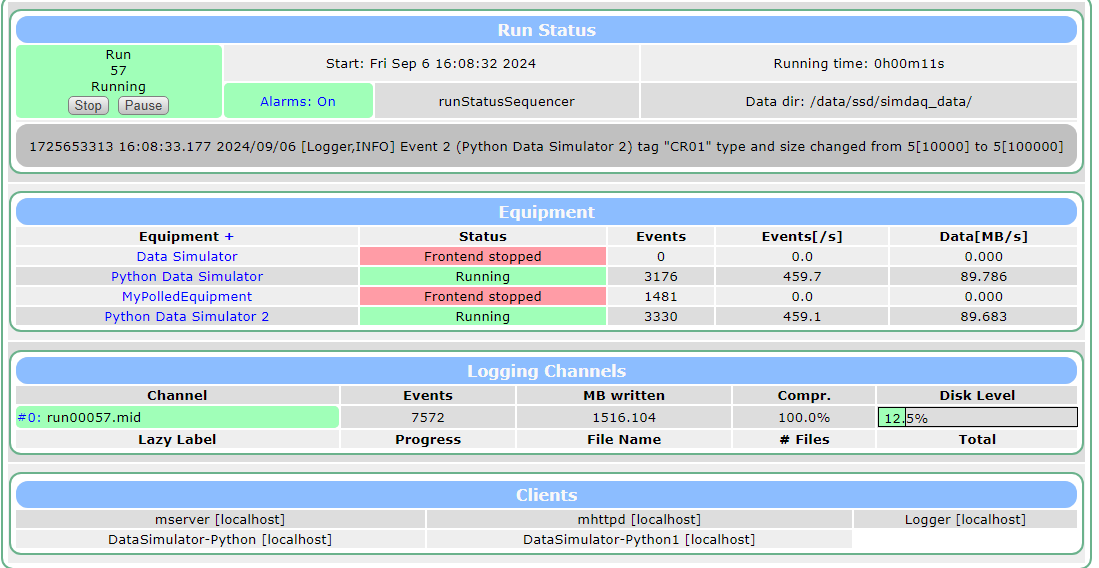
Furthermore, we see limited bottlenecking due to logger on (this screenshot of logger being off)